Very few options exist for researchers working with the anthropometric scores of children to batch process the weight and height data into weight for age or height for age z scores. One of them is Epi Info. However, a naive user may find working with Epi Info absolutely tiresome, inefficient and clueless. I believe this is due to two main reasons. Firstly, the support for Epi Info is not very good (phConnect is a good platform for help, but the odds are that you may never find any clues to your snags). Secondly, Epi Info itself is very obstinate about its semantics and the data types and is bereft of flexibility. However, it may still be one of the best options for storing data and analysis.
Many a times your dataset will be an MS Excel file. Suppose you want to calculate the weight for age z score for a group children whose weight and age is available in your dataset. Ofcourse, if the sample size is not that large, manual computation is more than fine. But when it gets to higher sizes, things go nasty.
Convert age into age in months and then use that variable (for example, say, AgeMonths) for calculating zscores. This you can do in MS Excel itself.
Weight should be in kilograms and gender of children should be coded as 1 and 2 (1 for boys and 2 for girls).
All these three variables, Weight, AgeMonths and Gender should be of NUMERIC. It will usually be of type 'General' in Excel. So to convert from General to NUMERIC, select the columns of these three variables and select 'Number' from the drop down menu within the HOME button of MS Excel. (Fig 1)
Next thing would be to inspect blank cells in all the three variables and replace them with some really big or really small number. This is important as Epi Info absolutely despises blank values and you will be stuck with really weird error messages. Suppose if you replace them with a really big number like 10000 for Weight, then after calculating zscores you will be able to see a really big zscore value which makes no sense in any planet and can easily remove them manually.
Epi Info likes .xls files than .xlsx or .csv (at least I felt so). So save the workbook as a .xls file.
The pre-processing part is now complete.
Next step would be to import this .xls file into Epi Info. Open Epi Info and then click: Classic --> Read. In the database type, choose MS Excel 97-2003 workbook (.xls) option. Then in Data Source, choose the .xls file that you have previously saved.
Give it some time. In the Data Source Explorer window, a dataframe name will come. Click it and then click OK. (Figure 2)
After you click OK, wait for a few seconds and if you have done it correctly, something like this would happen (Figure 3)
Now you have to create a variable (for example, say, WtAgeZscore) which will contain the weight for age z scores of the children in your dataset. This can be done by writing the command DEFINE WtAgeZscore NUMERIC in the program editor and clicking 'Run Commands' (Figure 4)
Now you are ready to generate weight for age z scores.
Please go through the official documentation from CDC.
If you are using CDC 2000 standards, then the command should be (see Figure 5)
ASSIGN WtAgeZscore = ZSCORE("CDC 2000", "WtAge", Weight, AgeMonths, Gender)
After writing the command, click 'Run Commands'
That's it. You have generated weight for age z scores in your dataset.
Next step would be to EXPORT this dataset with the WtAgeZscore variable. This can be done by clicking 'Write(Export)' in the left vertical pane of Epi Info. You have to have an already existing .xls file so that you can give it as the 'Connection Information' and a new sheet name ('wtagezscore' in this example) as the 'Destination Table' (see Figure 6).
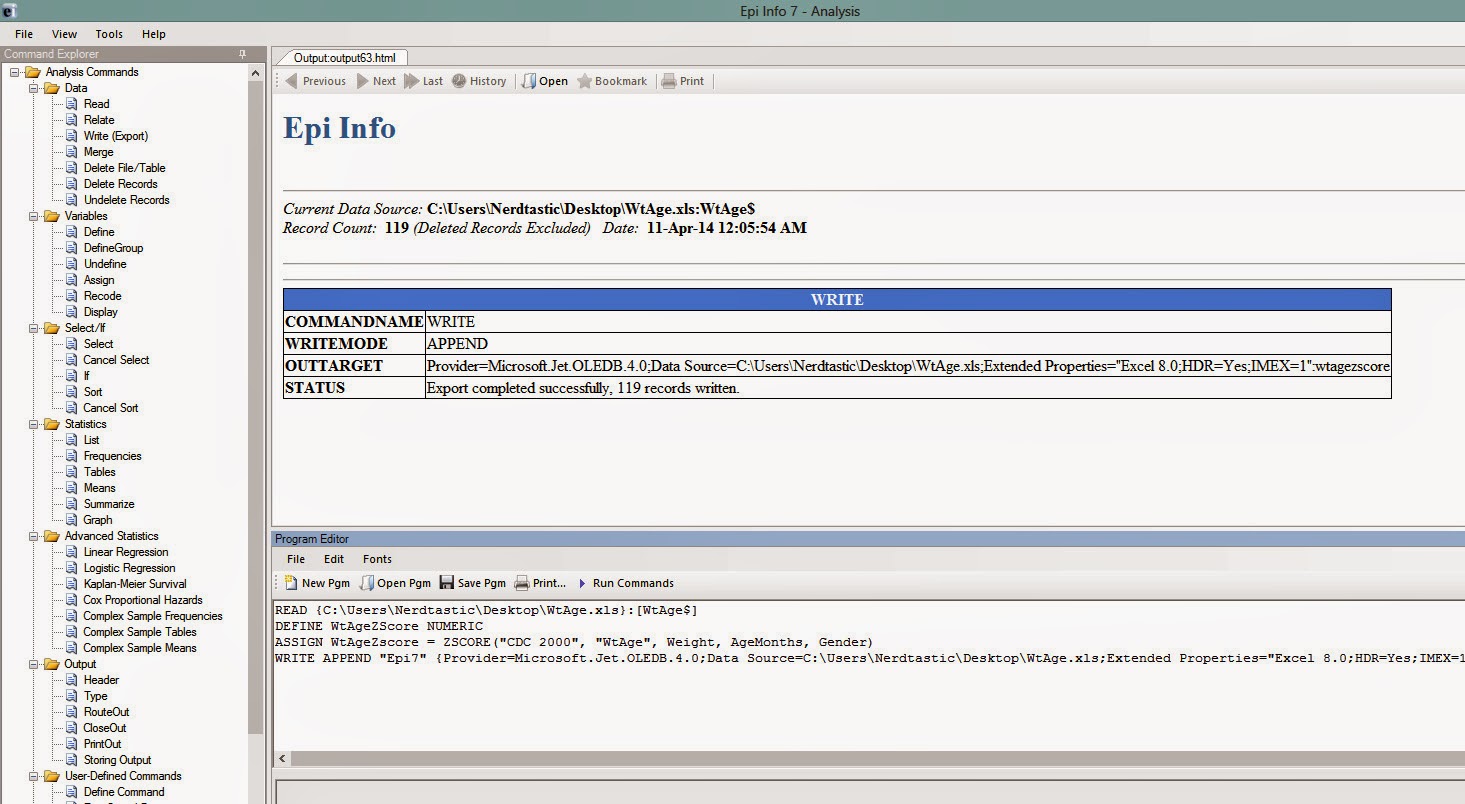
If everything goes fine, your Epi Info should look like this:
That's it. You have a new dataset now with all the weight for age z scores of children according to CDC 2000 charts. Do not forget to find the weird values (the values corresponding to blank cells which we manipulated) and remove them so that you can work with your dataset.
Many a times your dataset will be an MS Excel file. Suppose you want to calculate the weight for age z score for a group children whose weight and age is available in your dataset. Ofcourse, if the sample size is not that large, manual computation is more than fine. But when it gets to higher sizes, things go nasty.
Convert age into age in months and then use that variable (for example, say, AgeMonths) for calculating zscores. This you can do in MS Excel itself.
Weight should be in kilograms and gender of children should be coded as 1 and 2 (1 for boys and 2 for girls).
All these three variables, Weight, AgeMonths and Gender should be of NUMERIC. It will usually be of type 'General' in Excel. So to convert from General to NUMERIC, select the columns of these three variables and select 'Number' from the drop down menu within the HOME button of MS Excel. (Fig 1)
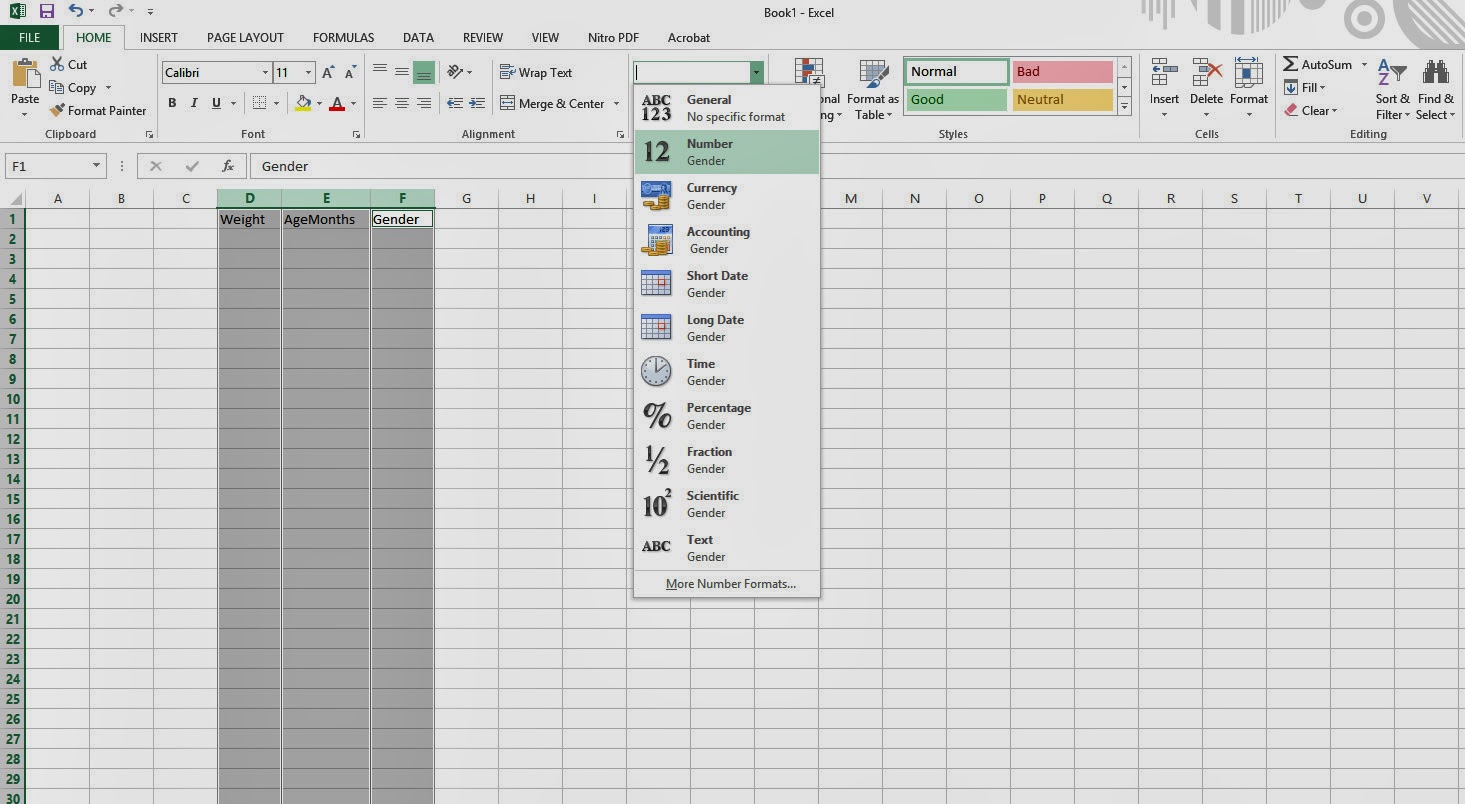 | |
| Figure 1 |
Next thing would be to inspect blank cells in all the three variables and replace them with some really big or really small number. This is important as Epi Info absolutely despises blank values and you will be stuck with really weird error messages. Suppose if you replace them with a really big number like 10000 for Weight, then after calculating zscores you will be able to see a really big zscore value which makes no sense in any planet and can easily remove them manually.
Epi Info likes .xls files than .xlsx or .csv (at least I felt so). So save the workbook as a .xls file.
The pre-processing part is now complete.
Next step would be to import this .xls file into Epi Info. Open Epi Info and then click: Classic --> Read. In the database type, choose MS Excel 97-2003 workbook (.xls) option. Then in Data Source, choose the .xls file that you have previously saved.
Give it some time. In the Data Source Explorer window, a dataframe name will come. Click it and then click OK. (Figure 2)
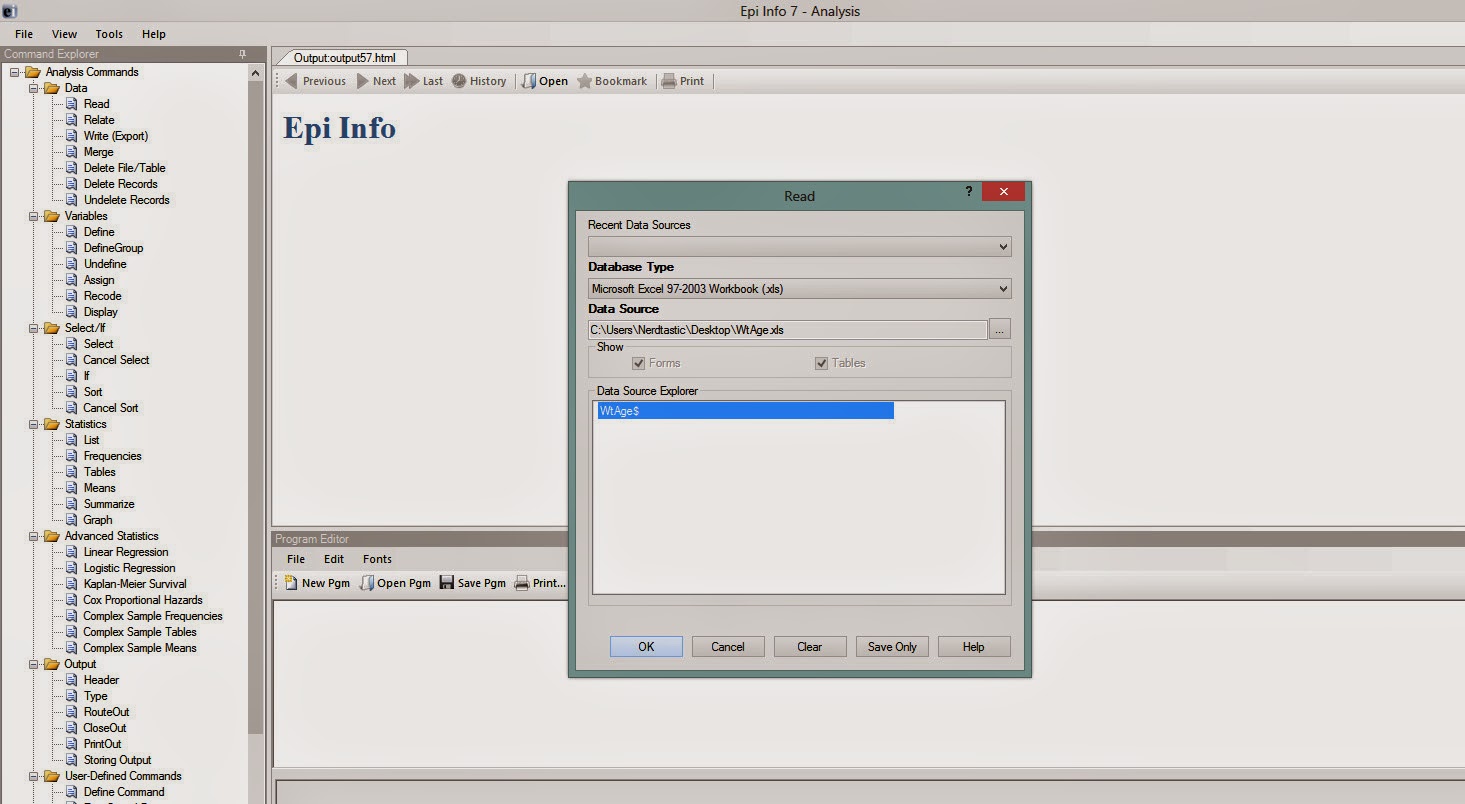 | ||||
| Figure 2 |
 |
| Figure 3 |
Now you have to create a variable (for example, say, WtAgeZscore) which will contain the weight for age z scores of the children in your dataset. This can be done by writing the command DEFINE WtAgeZscore NUMERIC in the program editor and clicking 'Run Commands' (Figure 4)
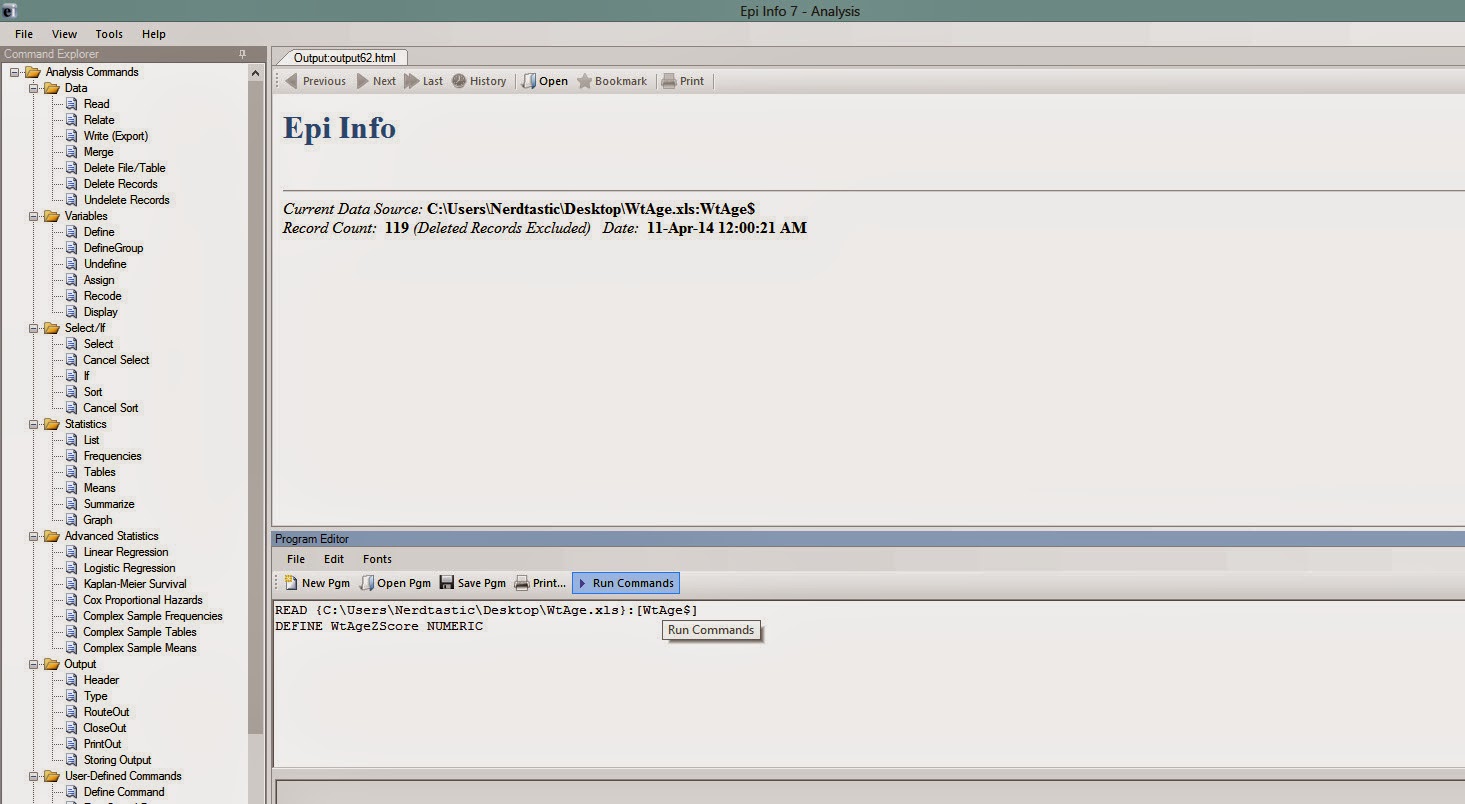 |
| Figure 4 |
Now you are ready to generate weight for age z scores.
Please go through the official documentation from CDC.
If you are using CDC 2000 standards, then the command should be (see Figure 5)
ASSIGN WtAgeZscore = ZSCORE("CDC 2000", "WtAge", Weight, AgeMonths, Gender)
After writing the command, click 'Run Commands'
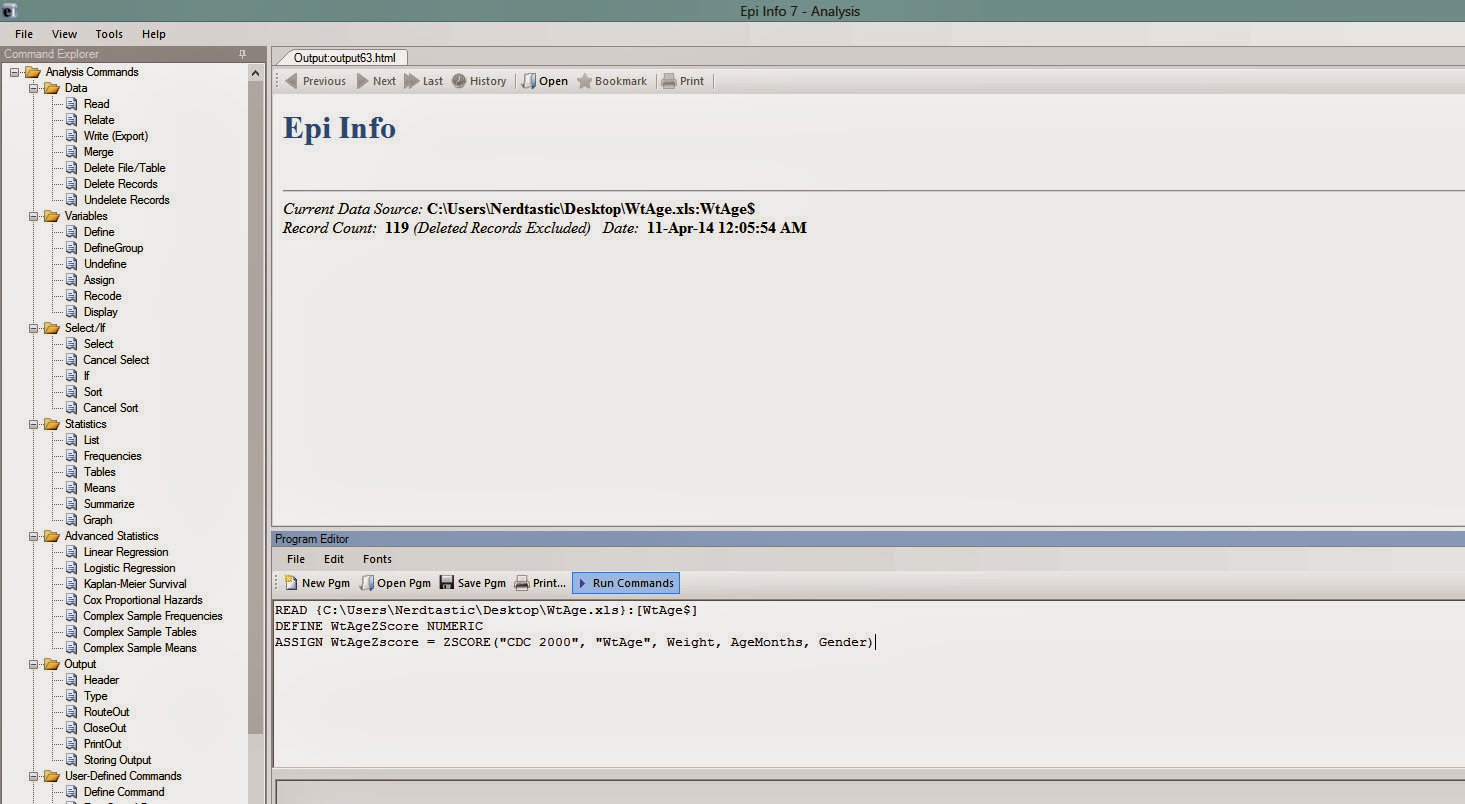 |
| Figure 5 |
Next step would be to EXPORT this dataset with the WtAgeZscore variable. This can be done by clicking 'Write(Export)' in the left vertical pane of Epi Info. You have to have an already existing .xls file so that you can give it as the 'Connection Information' and a new sheet name ('wtagezscore' in this example) as the 'Destination Table' (see Figure 6).
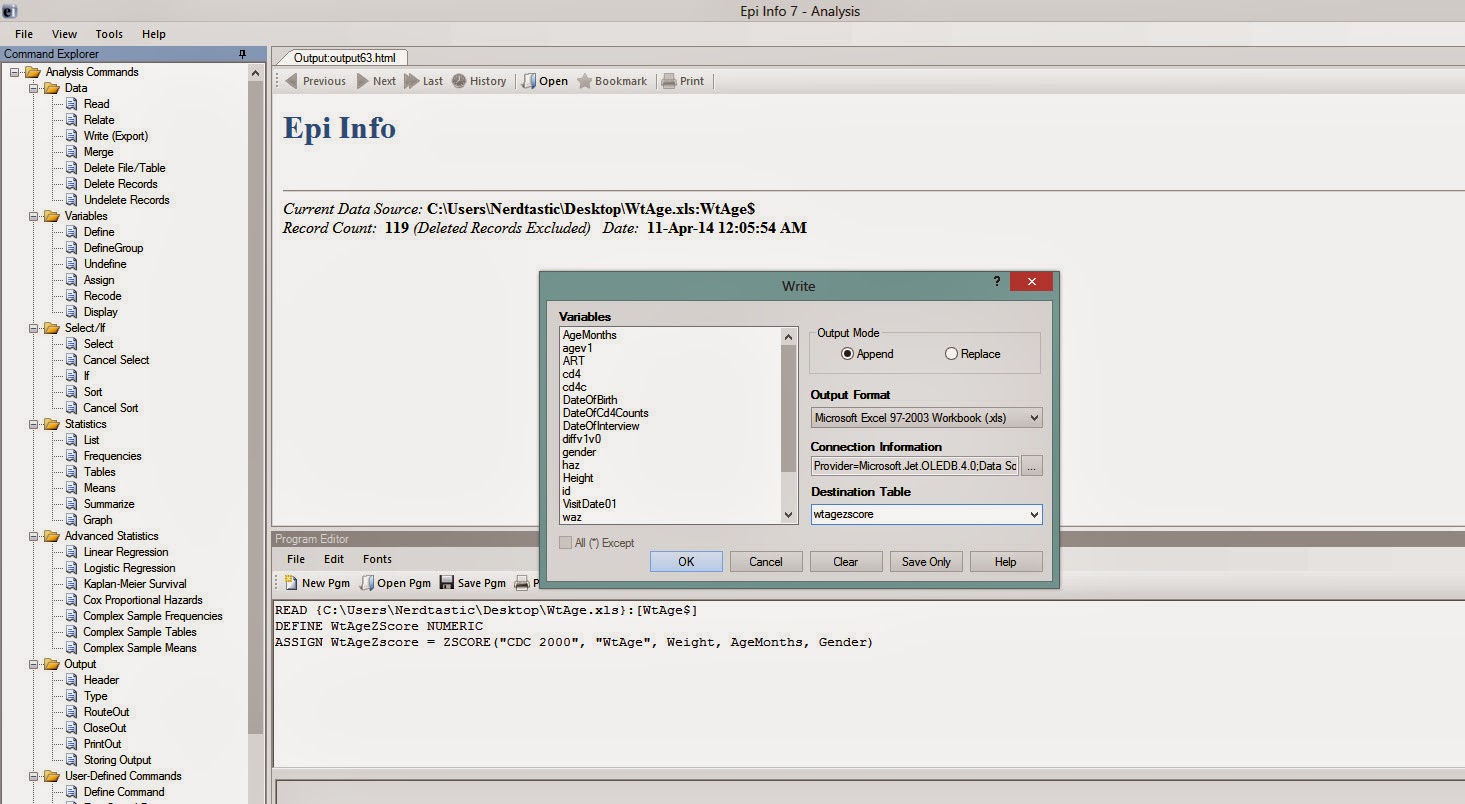 |
| Figure 6 |
 |
| Figure 7 |
That's it. You have a new dataset now with all the weight for age z scores of children according to CDC 2000 charts. Do not forget to find the weird values (the values corresponding to blank cells which we manipulated) and remove them so that you can work with your dataset.